

Hyperlocal rainfall totals + real-time NOAA forecasts
Accurate weather without the clutter
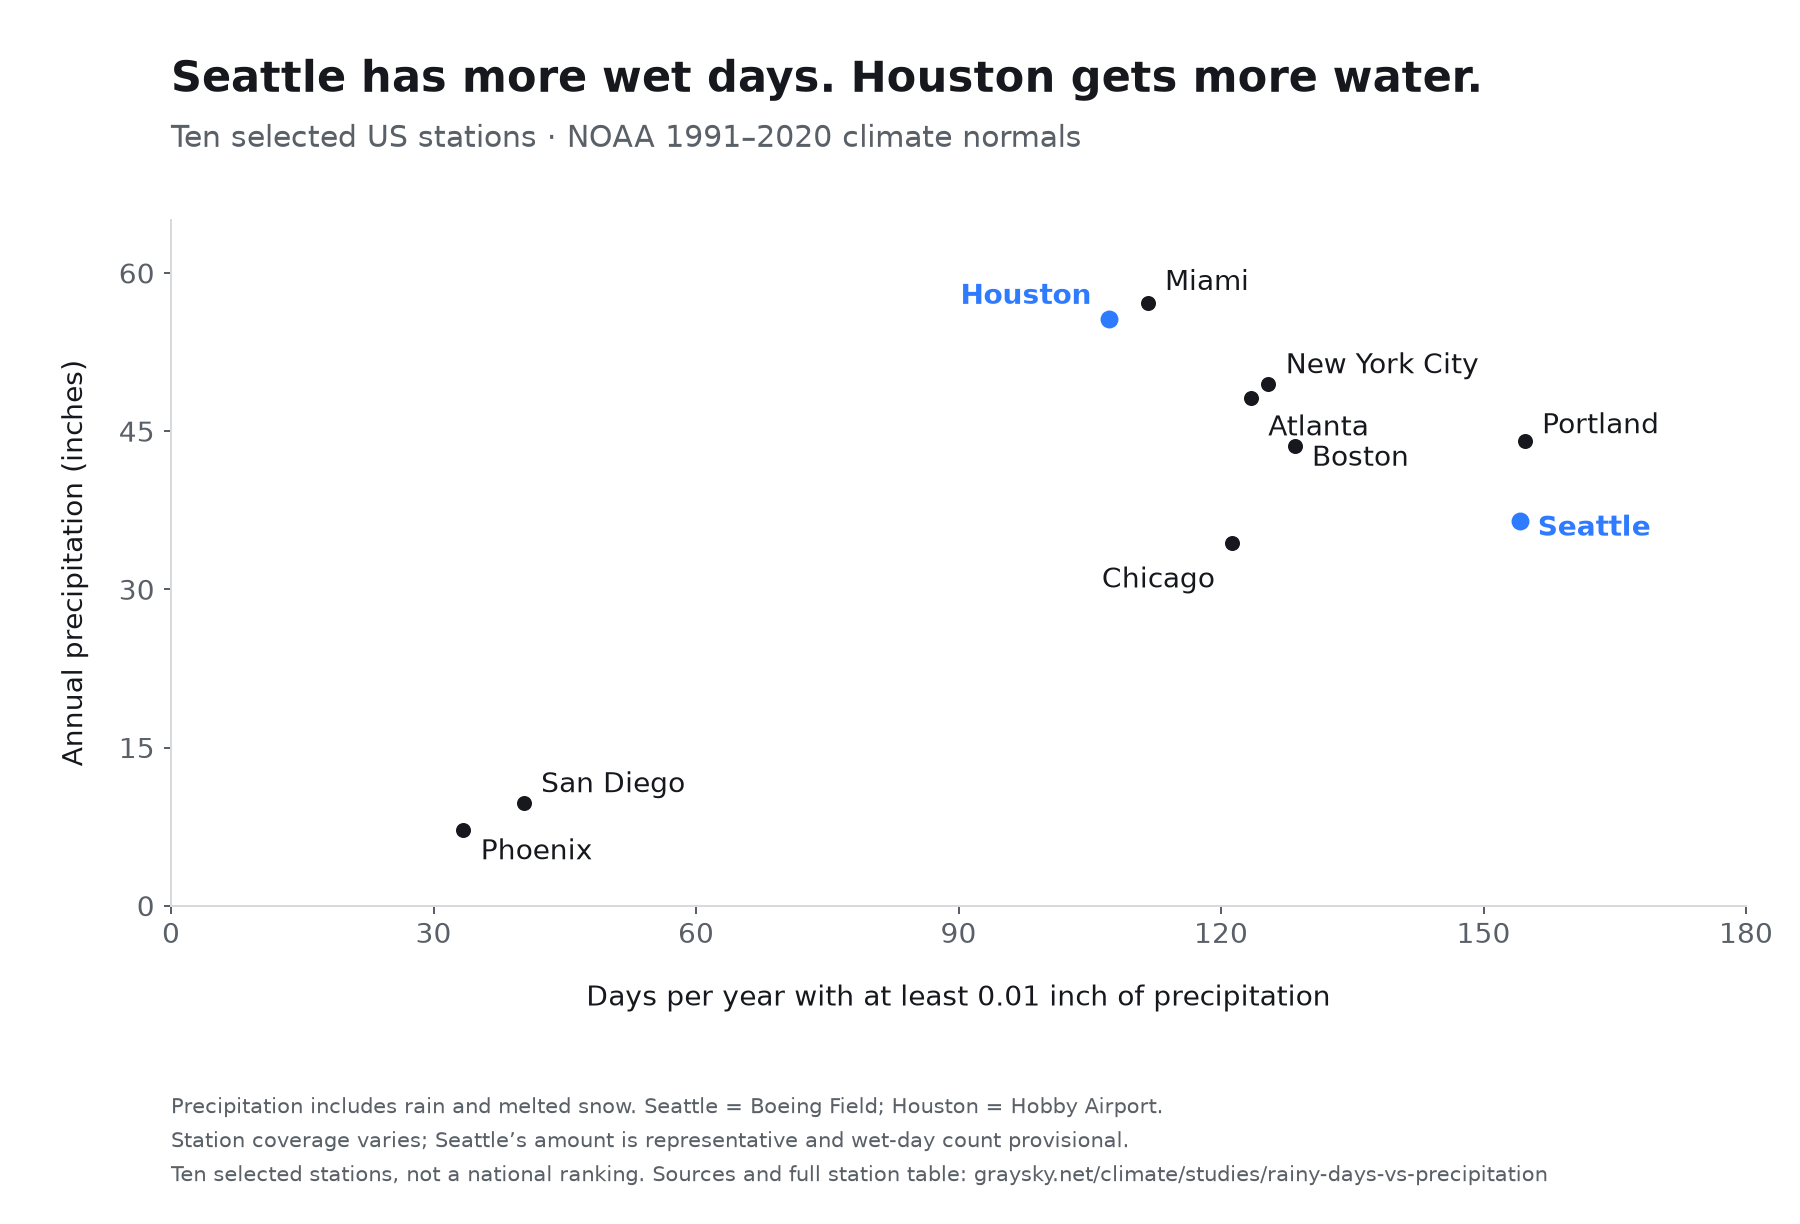
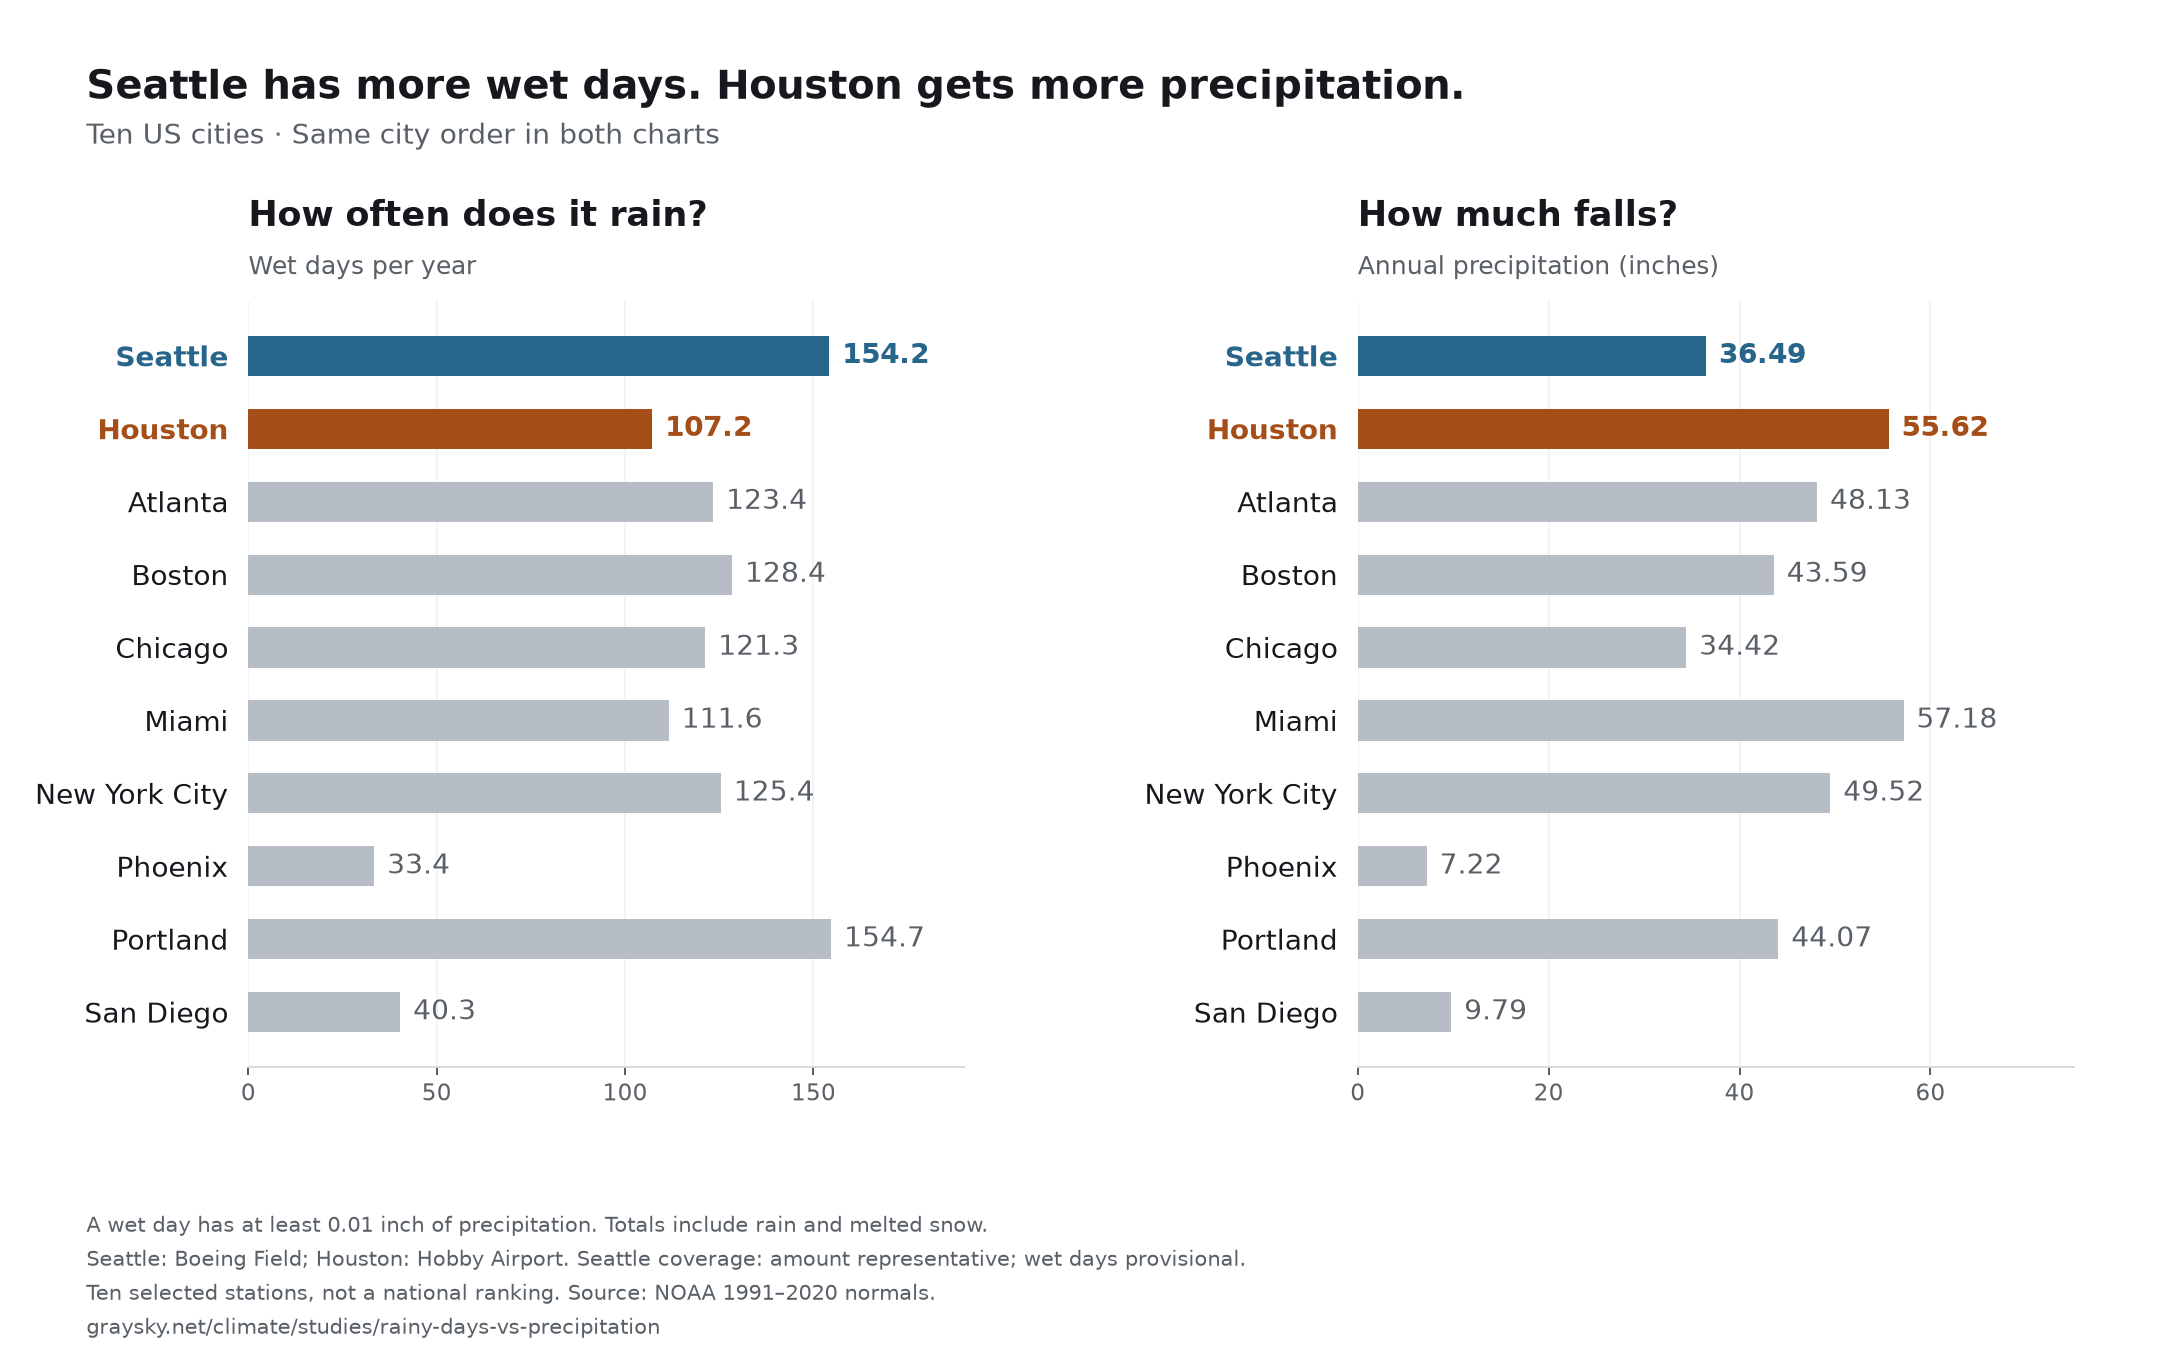
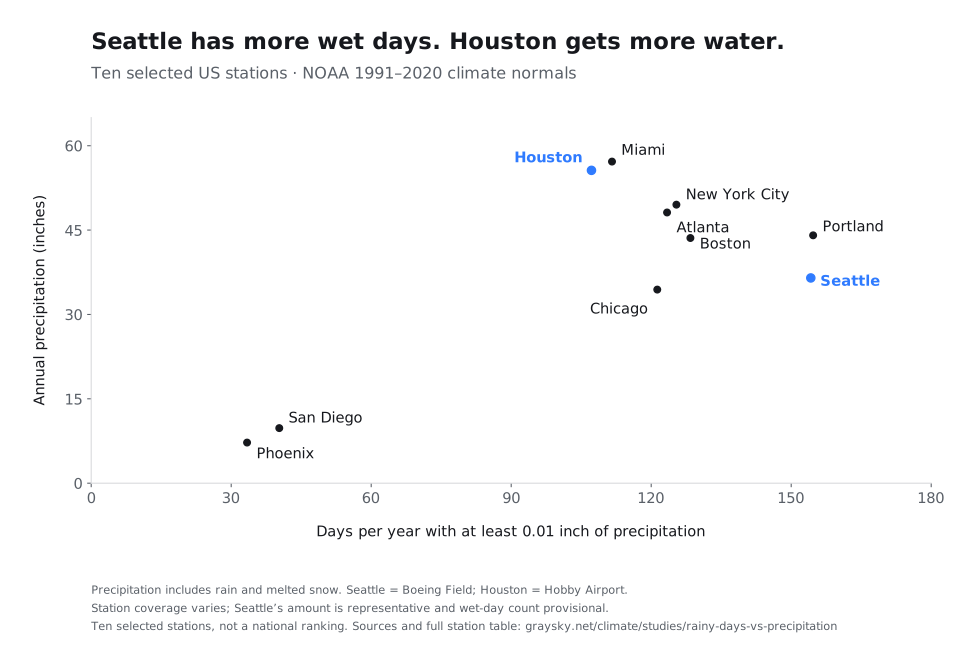
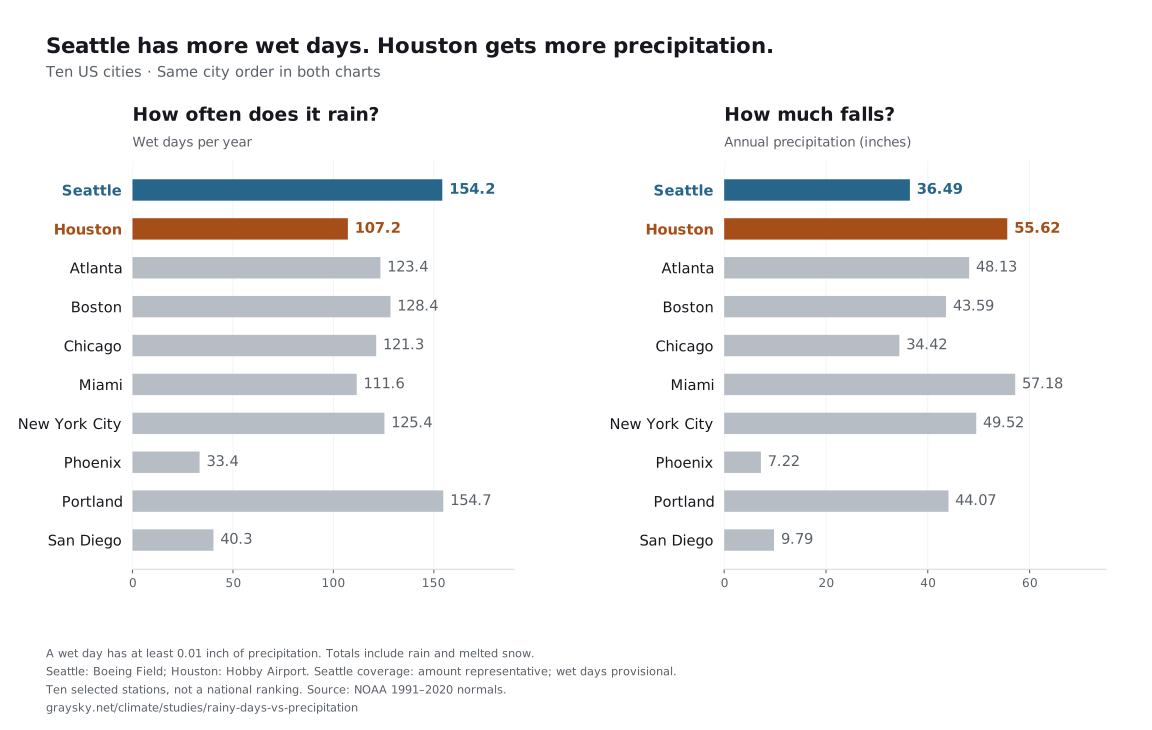
10 selected US stations · NOAA 1991–2020 normals
How often it rains and how much falls tell different stories.
Not necessarily. Seattle has frequent wet days, but several cities in this comparison receive more water over the year. Many days of light rain can add up to less than fewer heavy downpours.
Houston’s average annual precipitation is 55.62 inches, compared with 36.49 inches in Seattle. Yet Houston has 107.2 wet days per year, against Seattle’s 154.2.
That is 52.4% more precipitation in 30.5% fewer wet days at the Houston station. These are long-term averages at specific stations. The measurements include rain and the water equivalent of snow and other frozen precipitation. NOAA classifies the Seattle amount as representative and its wet-day count as provisional; coverage details appear below.
If you want to know how often you might need a rain jacket, the number of wet days is useful context. If you want to compare how much water falls, look at the annual amount. Neither number tells you whether your particular trip will be rainy.
A wet day does not mean rain all day. This comparison does not measure the number of rainy hours, storm intensity, flood risk or what the weather will be on your trip. For a trip, start with Seattle’s monthly climate averages to see how conditions change through the year, then check the forecast closer to your dates.
A wet day has at least 0.01 inch (0.254 mm) of precipitation. Annual amounts include rain and the liquid equivalent of frozen precipitation. Cities are listed alphabetically.
| City | Wet days / year | Inches / year | Reporting station |
|---|---|---|---|
| Atlanta, GA | 123.4 | 48.13 | ATLANTA FULTON CO AP, GA US USW00003888 · NOAA source CSV |
| Boston, MA | 128.4 | 43.59 | BOSTON LOGAN INTL AP, MA US USW00014739 · NOAA source CSV |
| Chicago, IL | 121.3 | 34.42 | CHICAGO MIDWAY AP, IL US USW00014819 · NOAA source CSV |
| Houston, TX | 107.2 | 55.62 | HOUSTON HOBBY AP, TX US USW00012918 · NOAA source CSV |
| Miami, FL | 111.6 | 57.18 | MIAMI BEACH, FL US USW00092811 · NOAA source CSV |
| New York City, NY | 125.4 | 49.52 | NEW YORK CNTRL PK TWR, NY US USW00094728 · NOAA source CSV |
| Phoenix, AZ | 33.4 | 7.22 | PHOENIX SKY HARBOR INTL AP, AZ US USW00023183 · NOAA source CSV |
| Portland, OR | 154.7 | 44.07 | PORTLAND KGW-TV, OR US USC00356749 · NOAA source CSV |
| San Diego, CA | 40.3 | 9.79 | SAN DIEGO LINDBERGH FLD, CA US USW00023188 · NOAA source CSV |
| Seattle, WA | 154.2 | 36.49 | SEATTLE BOEING FLD, WA US USW00024234 · NOAA source CSV |
GraySky selected ten familiar cities across Pacific Northwest, eastern, southern and arid US climates before fetching the data. For each city, we used the station selected by GraySky’s climate endpoint, then fetched that station’s official NOAA NCEI annual normals file. This is a selected sample, not a representative survey or a ranking of the rainiest US cities.
The paired fields are ANN-PRCP-NORMAL (annual precipitation, inches) and ANN-PRCP-AVGNDS-GE001HI (days per year with at least 0.01 inch). We retain NOAA’s published values and calculate percentage differences before rounding to one decimal place. The period is 1991–2020; source files were retrieved on .
Stations represent a measurement location, often an airport, rather than an entire city. Houston uses the Hobby Airport station; Seattle uses Boeing Field; Miami uses the Miami Beach station. Coastal, elevation and urban differences matter. The city climate pages derive some metrics from daily observations and may use different thresholds; this study uses the two official NOAA fields consistently.
NOAA fills some missing monthly values using nearby stations. Its standard, representative and provisional flags describe data availability and estimation. A shared 30-year period does not mean every station has 30 observed years. The table below shows how many years of data support each metric, followed by NOAA’s data-quality classification. For example, “20 years · Representative” describes data coverage, not 20 inches of precipitation.
NOAA Climate Normals overview · File and flag definitions · Annual normals documentation
Standard: at least 24 qualifying years. Representative: at least 10, with missing months eligible for estimation from surrounding stations. Provisional: at least 10, with missing months not filled that way. The source files give the reported counts shown here; NOAA’s completeness classification is retained as published.
| City | Annual precipitation data | Wet-day data |
|---|---|---|
| Atlanta | 20 years · Representative | 22 years · Provisional |
| Boston | 29 years · Standard | 30 years · Standard |
| Chicago | 20 years · Representative | 22 years · Provisional |
| Houston | 30 years · Standard | 30 years · Standard |
| Miami | 24 years · Standard | 26 years · Standard |
| New York City | 30 years · Standard | 30 years · Standard |
| Phoenix | 30 years · Standard | 30 years · Standard |
| Portland | 21 years · Representative | 26 years · Standard |
| San Diego | 29 years · Standard | 30 years · Standard |
| Seattle | 19 years · Representative | 21 years · Provisional |
Download the complete data with station coordinates, source links, NOAA flags, retrieval dates and source hashes. NOAA data are publicly available. GraySky’s original chart and analysis are available under CC BY 4.0; credit GraySky and link to this study.
Data CSV · Data JSON · Chart PNG · Reuse license
Suggested citation: GraySky, “Does Seattle really get more rain than other cities?” analysis snapshot 2026-09-05, using NOAA NCEI 1991–2020 station normals.